(‘000 TL) |
31 December 2016 |
31 December 2015 |
Change (%) |
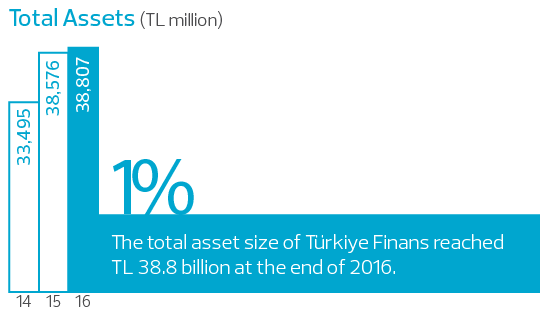
Assets |
38,807,717 |
38,576,299 |
1 |
|---|---|---|---|
Cash and Banks |
6,230,623 |
5,597,872 |
11 |
Securities |
4,063,820 |
3,173,456 |
28 |
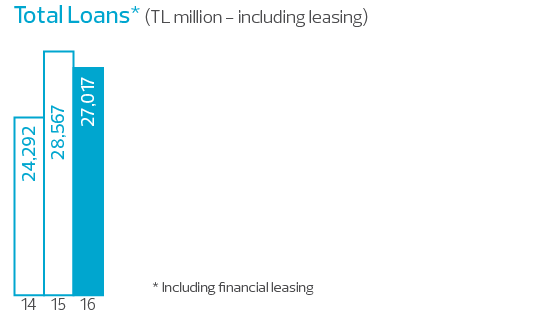
Loans |
25,599,230 |
27,014,513 |
(5) |
Receivables from Leases |
1,417,512 |
1,552,415 |
(9) |
Fixed Assets (Net) |
741,309 |
512,130 |
45 |
Other Assets |
755,223 |
725,913 |
4 |
|
|
|
|
Liabilities |
38,807,717 |
38,576,299 |
1 |
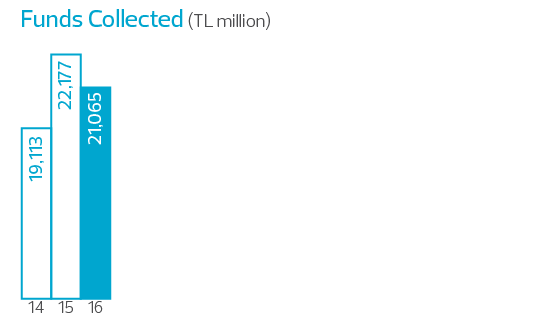
Funds Collected |
21,064,781 |
22,177,414 |
(5) |
- Special Current Accounts* |
5,773,877 |
5,432,281 |
6 |
- Participation Accounts* |
15,290,904 |
16,745,133 |
(9) |
Loans Received |
10,256,573 |
8,657,646 |
18 |
Subordinated Loans |
890,500 |
733,023 |
21 |
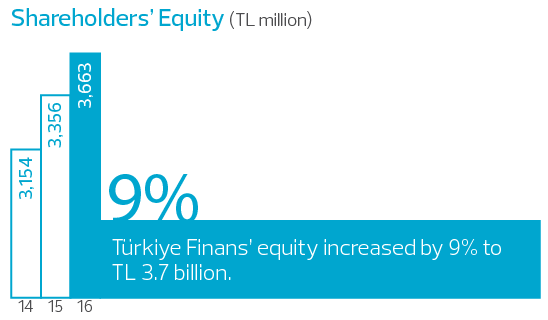
Shareholders’ Equity |
3,663,014 |
3,356,757 |
9 |
Paid-Up Capital |
2,600,000 |
2,600,000 |
0 |
Other Liabilities |
2,932,849 |
3,651,459 |
(20) |
|
|
|
|
Non-Cash Loans |
12,361,123 |
12,502,404 |
(1) |
|
|
|
|
Income and Expense Accounts |
01/01/2016-31/12/2016 |
01/01/2015-31/12/2015 |
|
Profit Share Income |
2,981,301 |
2,780,246 |
7 |
Profit Share Expenses |
(1,471,762) |
(1,375,984) |
7 |
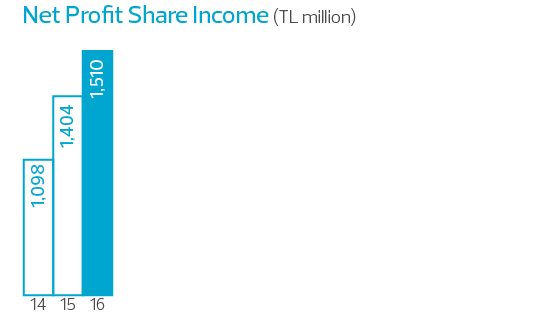
Net Profit Share Income |
1,509,539 |
1,404,262 |
7 |
Net Fee and Commission Income |
143,012 |
142,469 |
0 |
Other Non-Profit Income |
413,083 |
145,108 |
185 |
Non-Profit Share Expenses |
(1,696,559) |
(1,359,014) |
25 |
Profit Before Tax |
369,075 |
332,825 |
11 |
Provision For Taxes |
(72,832) |
(71,749) |
2 |
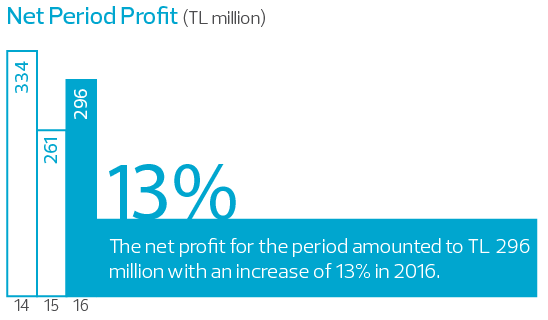
Net Period Profit |
296,243 |
261,076 |
13 |
|
|
|
|
Key Ratios |
31 December 2016 |
31 December 2015 |
|
Capital Adequacy Ratio |
15.58% |
13.51% |
|
Return on Equity (Annual) |
8.44% |
8.02% |
|
Loans / Total Assets** |
69.62% |
74.05% |
|
Current Accounts / Funds Collected |
27.41% |
24.49% |
|
Non-Performing Loans (Gross) / Loans |
5.00% |
4.27% |
|
|
|
|
|
Other |
31 December 2016 |
31 December 2015 |
|
Total Number of Branches |
286 |
286 |
|
Total Number of Personnel |
3,989 |
4,132 |
|
* Special current accounts and participation accounts include precious-metal accounts.
** Loans include financial leasing receivables.