FINANCIAL POSITION
(TL thousand) |
31 December 2022 |
31 December 2023 |
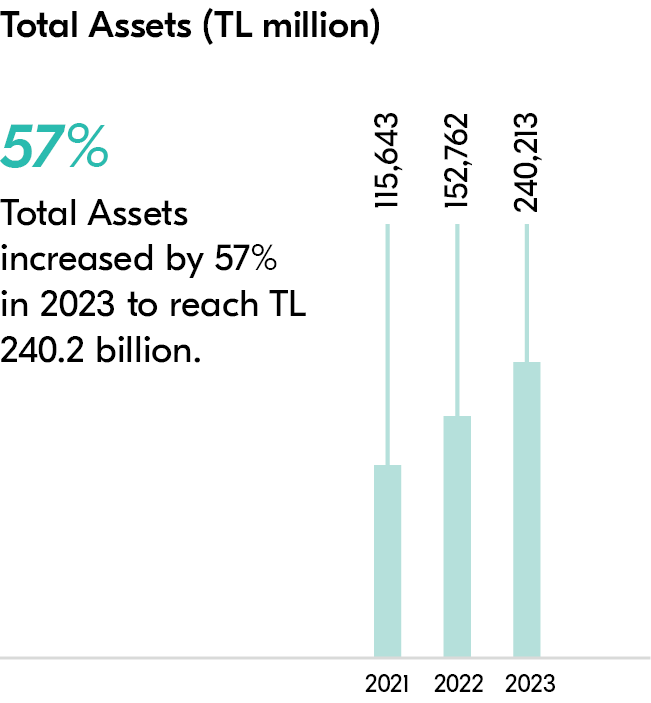
Assets |
152,762,122 |
240,212,941 |
Financial Assets (Net) |
62,349,535 |
92,859,138 |
Cash and cash equivalents |
29,717,788 |
52,485,973 |
Financial assets valued at fair value through profit or loss |
4,528,581 |
8,396,705 |
Financial assets valued at fair value through other comprehensive income |
27,788,086 |
31,655,442 |
Derivative financial assets |
315,080 |
321,018 |
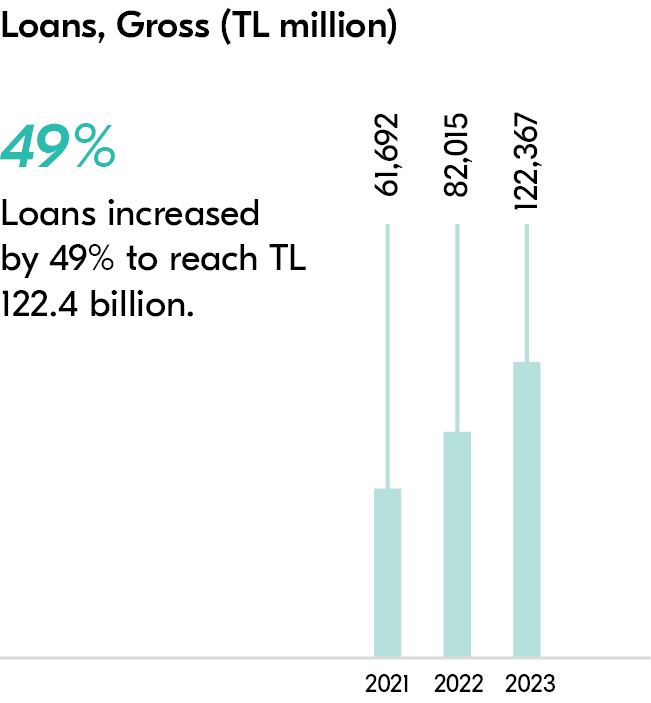
Loans (Gross)1 |
82,014,948 |
122,367,093 |
Other financial assets valued at amortized cost |
7,036,428 |
18,024,103 |
Expected Loss Provisions (-) |
(3,427,400) |
(3,258,270) |
Tangible Assets (Net) |
2,712,010 |
6,073,948 |
Other Assets2 |
2,076,601 |
4,146,929 |
|
|
|
Liabilities |
152,762,122 |
240,212,941 |
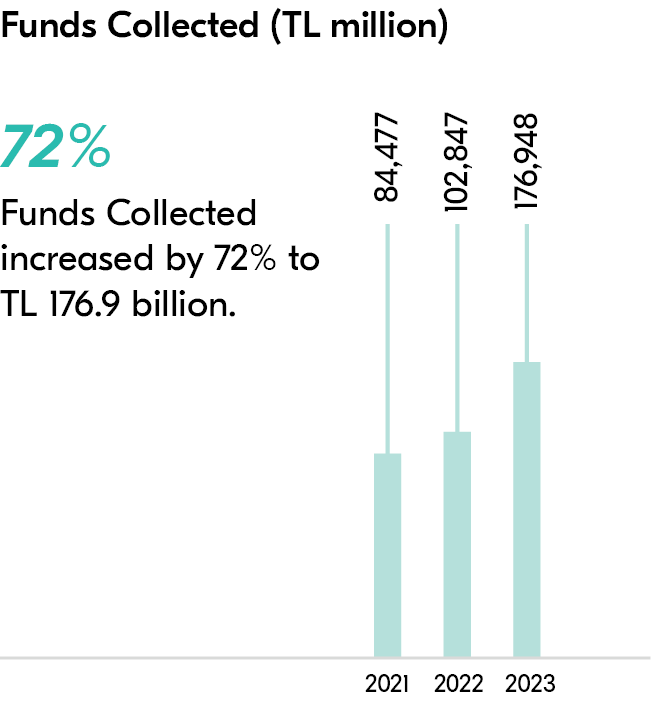
Funds Collected |
102,847,258 |
176,948,428 |
Special Current Accounts |
43,084,050 |
56,803,908 |
Participation A ccounts3 |
59,763,208 |
120,144,520 |
Funds Borrowed |
21,996,683 |
24,931,916 |
Money Markets Borrowings |
3,130,312 |
5,447 |
Subordinated Debts |
4,678,005 |
7,364,950 |
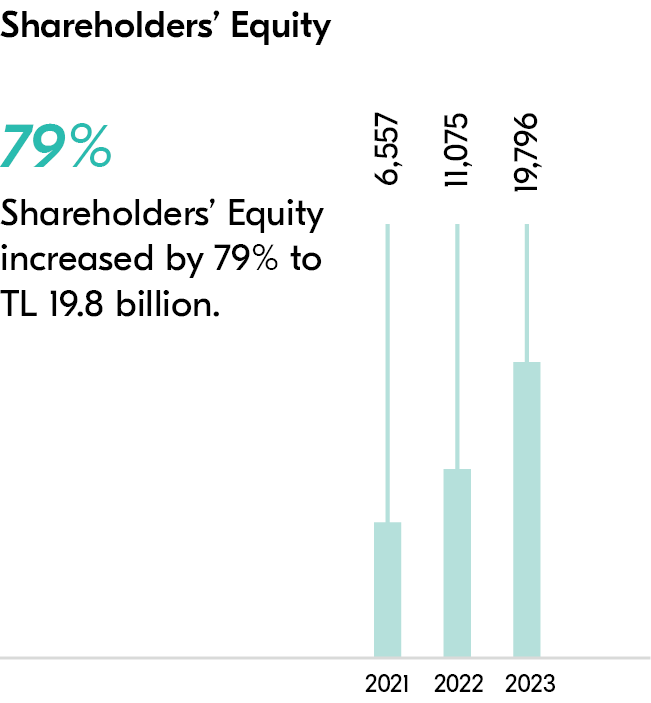
Shareholders’ Equity |
11,075,195 |
19,796,409 |
Paid-Up Capital |
2,600,000 |
2,600,000 |
Other Liabilities4 |
9,034,669 |
11,165,791 |
|
|
|
Non-Cash Loans |
18,850,951 |
33,886,588 |
(1) The funds allocated include financial leasing receivables.
(2) Assets excluding financial assets (net), loans (gross), other financial assets measured at amortized cost, tangible fixed assets (net) and expected loss provisions.
(3) Precious metal accounts are included in the participation accounts.
(4) Liabilities excluding funds collected, funds borrowed, money market borrowings, subordinated debts and shareholders’ equity.
INCOME/EXPENSE RATIOS-OTHERS
Income and Expense Accounts (TL thousand) |
01 January - 31 December 2022 |
01 January - 31 December 2023 |
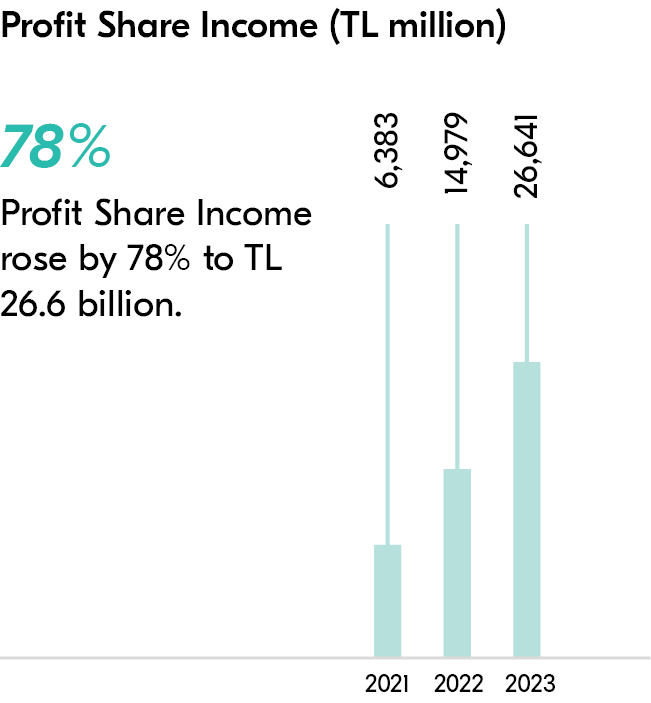
Profit Share Income |
14,979,063 |
26,641,122 |
Profit Share Expenses |
(7,621,113) |
(19,097,210) |
Net Profit Share Income |
7,357,950 |
7,543,912 |
Net Fee and Commission Income |
447,523 |
2,640,562 |
Other Non-Profit Income |
2,933,375 |
5,387,269 |
Non-Profit Share Expenses |
(6,531,238) |
(7,928,467) |
Profit Before Tax |
4,207,610 |
7,643,276 |
Provision For Taxes |
(1,303,505) |
(1,799,134) |
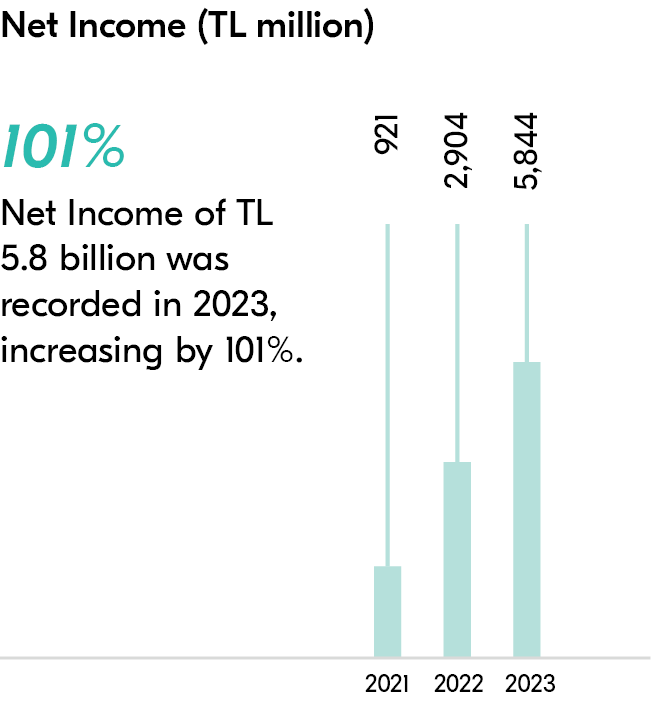
Net Income |
2,904,105 |
5,844,142 |
|
|
|
Ratios (%) |
31/12/2022 |
31/12/2023 |
Capital Adequacy Ratio |
21.09 |
25.85 |
Loans / Total Assets (*) |
53.7 |
50.9 |
Current Accounts / Funds Collected |
41.89 |
32.10 |
|
|
|
Other |
31/12/2022 |
31/12/2023 |
Total Number of Branches |
308 |
305 |
Total Number of Personnel |
3,735 |
3,824 |
(*) Loans include financial leasing receivables.