Summary Financial Information (Annual)
Türkiye Finans demonstrated stronger growth than the sector and reflected also its successful performance in 2013 to its financial results.
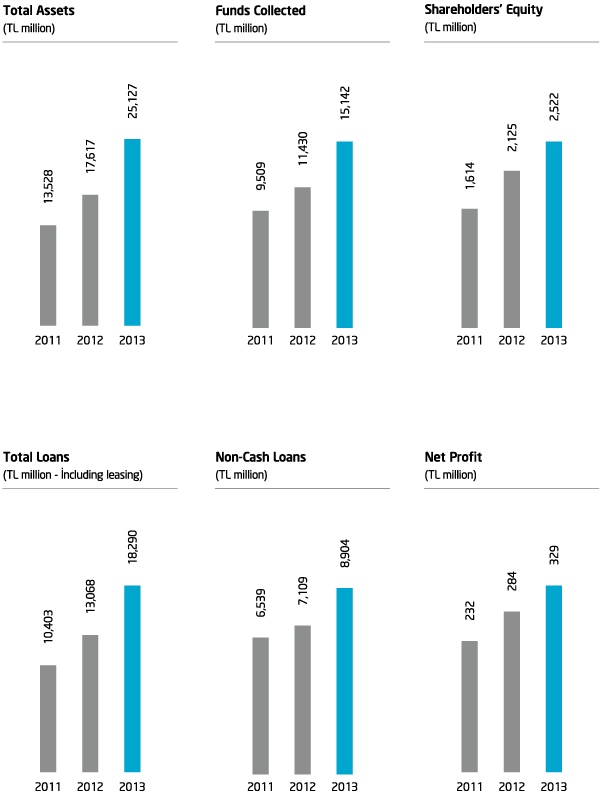
As of and for the period ended 31.12.2013 (TL thousand)
|
2013 |
2012 |
Change % |
|---|---|---|---|
Assets |
25,126,629 |
17,616,504 |
42.63 |
Cash and Banks |
4,790,457 |
3,315,196 |
44.50 |
Securities |
1,413,025 |
665,115 |
112.45 |
Loans |
17,447,961 |
12,763,400 |
36.70 |
Receivables from Leases |
841,649 |
304,369 |
176.52 |
Fixed Assets (Net) |
248,838 |
215,498 |
15.47 |
Other Assets |
384,699 |
352,926 |
9.00 |
|
|
|
|
Liabilities |
25,126,629 |
17,616,504 |
42.63 |
Funds Collected |
15,141,718 |
11,429,536 |
32.48 |
-Special Current Accounts |
3,440,407 |
2,527,809 |
36.10 |
-Participation Accounts |
11,701,311 |
8,901,727 |
31.45 |
Loans Received |
5,166,009 |
2,503,943 |
106.31 |
Shareholders’ Equity |
2,522,381 |
2,125,162 |
18.69 |
Paid-up Capital |
1,775,000 |
1,650,000 |
7.58 |
Other Liabilities |
2,296,521 |
1,557,863 |
47.41 |
|
|
|
|
Non-Cash Loans |
8,904,139 |
7,108,697 |
25.26 |
|
|
|
|
Income and Expense Accounts |
|
|
|
Profit Share Income |
1,566,233 |
1,410,356 |
11.05 |
Profit Share Expenses |
-692,150 |
-618,245 |
11.95 |
Net Profit Share Income |
874,083 |
792,111 |
10.35 |
Net Fee and Commission Income |
128,272 |
108,231 |
18.52 |
Other Non-Profit Income |
179,911 |
148,508 |
21.15 |
Non-Profit Share Expenses |
-769,754 |
-687,024 |
12.04 |
Profit Before Tax |
412,512 |
361,826 |
14.01 |
Provision for Taxes |
-83,235 |
-78,253 |
6.37 |
Net Period Profit |
329,277 |
283,573 |
16.12 |
|
|
|
|
Key Ratios (%) |
|
|
|
Capital Adequacy Ratio |
12.81 |
14.76 |
|
Return on Equity (Annual) |
14.17 |
15.17 |
|
Loans / Total Assets |
72.79 |
74.18 |
|
Current Accounts / Funds Collected |
22.72 |
22.12 |
|
Non-Performing Loans (Gross) / Loans |
2.41 |
2.74 |
|
|
|
|
|
Other |
|
|
|
Total Number of Branches |
250 |
220 |
13.64 |
Total Number of Personnel |
3,990 |
3,595 |
10.99 |
43%
The total assets of Türkiye Finans rose by 43% YoY in 2013, exceeding TL 25 billion.
32%
The total size of funds collected by the Bank surged by 32% to reach TL 15 billion.
40%
The total volume of loans, including financial leasing transactions supplied to customers increased by 40% YoY in 2013 and reached TL 18 billion.